We combine the most successful automated trading strategies with low correlation into portfolios that have long-term suitable parameters, have a low correlation and comparable risk. Thanks to this, they consistently achieve a very interesting appreciation in the long term.
Robust Portfolios
 What are our automated portfolios?
Our automated, robust portfolios are composed of multiple uncorrelated automation strategies. In this way, we reduce the level of risk to a lower value than with individual strategies. Well-balanced portfolios have a number of profitable months of up to 95%.
Well diversified portfolio in comparison to trading single strategy
Portfolio trading increases robustness and stability
The portfolio of low-correlation automated systems surpasses individual trading systems in many ways. In contrast to individual strategies, portfolios make more efficient use of capital less volatile.
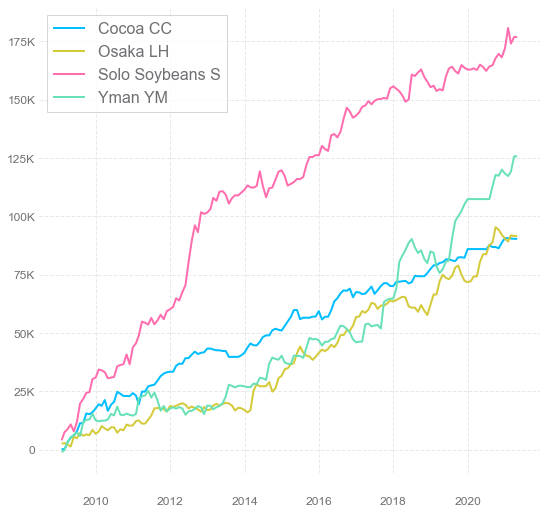
Individual Systems
Each individual strategy has better and worse periods. Some of them excel about every fifth year, some of them make decent profits every year.

Synergy of Portfolio
A well ballnced portfolio of uncorrelated systems creates several synergies and higher profits.
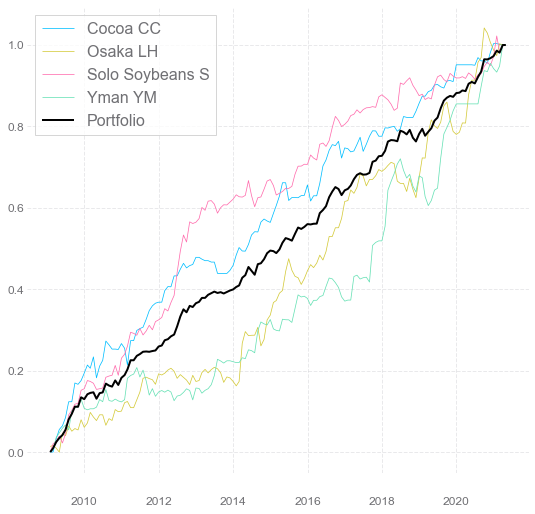
Portfolio Stability
The total portfolio equity curve is more stable and less volatile than the equity curve of individual strategies.
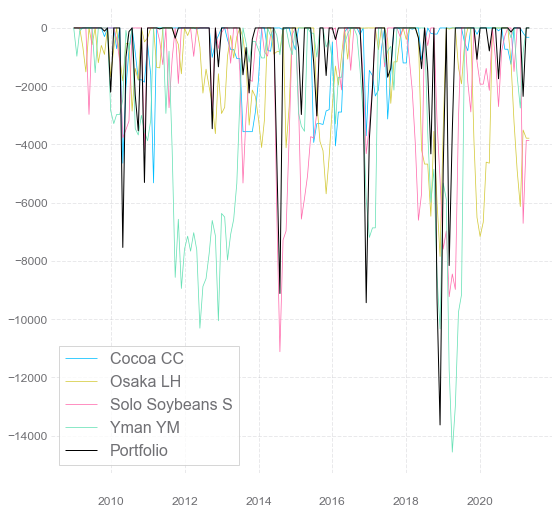
Spreaded Drawdowns
Loss periods of individual uncorrelated strategies tend to distribute over time. That is why portfolios even with higher profits show a lower risk.
Frequently Asked Questions
The design and creation of a portfolio proposal are FREE.
When you decide to trade it, you will pay by monthly subscription. The price is included in each portfolio proposal. Payment is usually charged by execution provider (broker) directly from your trading account.
Each portfolio has a different price. The price is preset and fixed. The monthly subscription is calculated as approximately 10% of the average monthly profits based on a calculation from a historical hypothetical performance simulation.
By agreement. We have clients of whom we take care and suggest updates of portfolios on a monthly or quarterly basis.
But we also have clients who ask for upgrades themselves or just trade their portfolio without any further input.
Trading is a dynamic process. There are 3 main reasons to make changes or updates to a portfolio.
- As clients’ accounts grow, we used to suggest extending portfolios to other systems for better diversification and capital usage. This is highly appreciated by clients because through better diversification, we can achieve much better risk-adjusted profits for our clients.
- There are some very specific situations on the market in which it is better to stay away from it for a couple of days or weeks. In such situations, we used to make the decision to turn off some systems for a short time period.
- Occasionally, we decide to turn off a strategy and replace it with another (better) one.
For retail clients, whose approach to trading is to earn money with a higher risk appetite, the absolute minimum recommended account size for futures portfolio trading is $30k. The optimum minimum is $50k+. And a reasonable account size is $100k-$120k.
For institutional clients or clients who look for an interesting absolute return on investment and want to keep risk to a maximum level of 8%-12% we recommend a minimum account size of $250k-$300k.
For a futures trading portfolio which trades 1 contract of each involved system (which is the minimum we are able to trade), the maximum risk for the whole portfolio will vary from approximately $20k to approximately $40k, depending on the variety of the portfolio and the systems included.
Of course, these numbers do not represent past drawdowns, which are usually much lower.
For bigger accounts, which start at $250k+, we can keep the risk below 10%.
Maximum drawdown is calculated based on past performance. It is the maximum observed loss from a peak to a trough of a portfolio. But nothing guarantees that the value of future drawdowns will be the same or lower.
Maximum risk calculation defines the magnitude of volatility which each portfolio needs and which is normal for it as well as a possible future biggest drawdown value.
The biggest drawdown is always ahead of you, which means that you need to know the value at which it is still normal as well as when to stop trading and prepare for it.
We use max. risk and VaR as the same parameter.
For the calculation of maximum risk, we use the Monte Carlo simulation with a confidence level of 99%.
This value means:
- It is the magnitude of volatility which each portfolio needs and which is natural for achieving short-term drawdowns in this magnitude,
- It is the point when we stop trading a specific portfolio because max. risk has been achieved,
- Put simply, it is a stop-loss for the whole portfolio.
In our case, risk-adjusted profit is a coeficient calculated as: Average annual net profit / max. risk
It represents how much $ we can potentially earn annually for 1$ of risk. The higher the number, the better.
This coeficient increases with better and wider diversification of a portfolio.
For example: risk-adjusted profit for a single system is usually around 0.5; for a mid-size portfolio, it is 2-3; and for a larger and wider portfolio, it can be 3-4 and potentially more.
Tailor made automated portfolio for you
We will setup a custom portfolio for you based on your needs and preferencies.